_web.webp?t=1782975679)
Misery Index regains relevance
Nearly forgotten index returns with climbing inflation, other challenges
Fifty years ago, the U.S. economy was facing a combination of high inflation and unemployment, which brought about the creation of the misery index.
Used to help measure general economic distress felt by the average citizen, the misery index originally was calculated simply by adding the rate of inflation and the unemployment rate.
With the current economy facing increased inflation, the misery index is gaining popularity once again. Now, however, unlike in the 1970s, more data points and measurements are available to provide greater details and an accurate picture of financial hardship.
Vange Ocasio Hochheimer, associate professor of economics at Whitworth University and CEO of Grand Fir Analytics, says, “A single data point isn’t as accurate as if you combined a number of data points. Economists will look at different data points to get a true assessment of the situation.”
She says the misery index is an appropriate tool to use in calculating a person’s potential strife because unemployment and inflation are miserable conditions to face, although it’s difficult to determine which factor causes more hardship.
“The misery index is a puzzle because it’s currently being driven by inflation,” she says, adding that the unemployment rate is much lower than the rate of inflation.
In June, the 12-month U.S. inflation rate was 9.1%, up from a 5.4% inflation rate a year earlier, according to the U.S. Bureau of Labor Statistics Consumer Price Index summary.
The unemployment rate in Spokane County in June was 4.4%, down from 5.6% a year earlier, according to Washington state Employment Security Department figures.
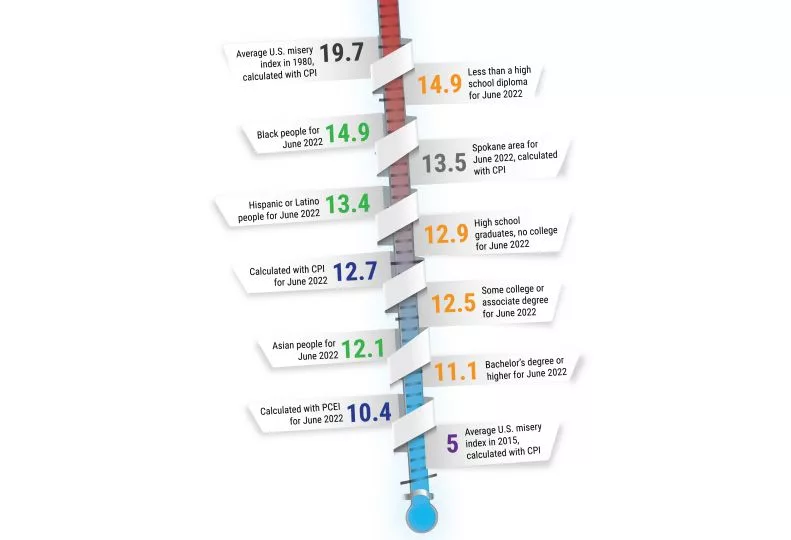
When added together, the Spokane-area misery index is 13.5 for June, up from 11 a year earlier, with a higher number signifying greater stress for consumers.
Grant Forsyth, chief economist at Spokane-based Avista Corp., says, calculating the misery index will depend on which data is used—the consumer price index or the personal consumption expenditures price index.
Forsyth says he recommends calculating the misery index with the personal consumption expenditures index, which would equate to a misery index of 10.4 in June.
“When the misery index was first created, you really only had one option for inflation and that was the consumer price index. Since the 1970s and 1980s, we now have a second, and probably better, measure of inflation. It’s actually what the Federal Reserve uses to gauge the appropriate monetary policy. That inflation measure is the personal consumption expenditures index,” Forsyth explains.
He says the CPI is still important for influencing economic policies and is useful in calculating wage adjustments and program spending adjustments, including Social Security payments. He adds, however, the CPI has been known to have a bias to overstate inflation.
“On average, over time it probably estimates inflation 0.2 to 0.3 percentage points higher,” Forsyth says. “The problem is when you run into accelerating inflation, that overstatement gets larger. Right now, the difference between CPI and the personal consumption expenditure index is probably 2 percentage points or more and why the Fed has switched to the personal consumption expenditure index as its primary gauge of inflation.”
Ocasio Hochheimer says the misery index also can be calculated with microdata to determine who is impacted more by these economic conditions.
She says unemployment rates that are broken down demographically will show the highest unemployment rates for African Americans, Hispanics, and Native Americans.
“The unemployment rate is not the same for every U.S. citizen. Minorities will have the highest unemployment rates,” she says. “Even if the economy looks resilient in that people are weathering higher prices ... the impacts will be different depending on who you are.”
The nationwide misery index calculated for Black people is 14.9; for Hispanic or Latino people, 13.4; and for Asian people, 12.1. The misery index by education level is 14.9 for those with less than a high school diploma; 12.9 for high school graduates with no college; 12.5 for those with some college, but no degree; and 11.1 for those with a bachelor’s degree or higher.
Even though more people are employed, it doesn’t mean they’re making an adequate wage, she says.
“If jobs are in the low-skill labor market and at a lower wage, then inflation is going to impact these people harsher than someone who makes a higher salary.”
Steve Scranton, chief investment officer and economist at Spokane-based Washington Trust Bank, says the misery index fell out of relevance for a long time because inflation and employment were stable.
Scranton says over the last 80 years, the average misery index was 8. He says the misery index was highest in 1980, when it averaged almost 22.
The average misery index for the 1980s decade was 12.8, he says, adding, “That index is back at 12.7 right now with unemployment at 3.6% and inflation at 9.1%.”
Scranton says the misery index is a good indicator of the general stress of the consumer, however, “I look at a much simpler picture … is their paycheck covering their expenses?”
To answer that question, Scranton suggests following the U.S. Bureau of Labor Statistics’ Real Average Hourly Earnings report, which represents wage growth versus inflation growth.
The latest data for June shows real average hourly earnings declined 1% from May. From June 2021 to June 2022, real average hourly earnings decreased 3.6% for all employees.
Ocasio Hochheimer adds that the current situation is unique due to the economy’s low unemployment rate, excluding the pandemic.
“When we look at that, that’s a sign of a thriving economy,” she says, adding that with a slight decrease in gross domestic product during the last two quarters, there are now some signs of a cooling economy.
Ocasio Hochheimer says the definition of a recession includes two quarters of declining gross domestic product and high unemployment. But, with unemployment rates declining, our economy doesn’t meet that definition completely.
“We’ve had a slight decrease in GDP growth for the last two quarters. However, a recession is going to be coupled with increased unemployment, but it’s not rising. It’s decreasing. That’s not to say a shallow recession isn’t predicted,” Ocasio Hochheimer says. “Many economists agree that in 2022-23 we’re going to have slower economic growth and a mild recession.”
The consumer confidence index can be used as another alternative measurement of consumer’s financial hardships, Ocasio Hochheimer explains.
The index measures consumer attitudes, buying intentions, vacation plans, and consumer expectations for inflation, stock prices, and interest rates, and has declined for a third consecutive month in July, to 95.7, according to data from The Conference Board, a New York-based nonprofit think tank.
That’s well below a post-pandemic high of 127.3 in mid-2021, but far above the Great Recession low of 27.5 in early 2009.
“We tend to forget we have a business cycle, which is a short period of booms and busts in the economy. I think that because we’ve had such a long period of expansion in the U.S. economy, people think that’s the norm, and it’s not,” Ocasio Hochheimer says.
She adds, “When you look at the data, it is a higher inflation rate than what we’re used to, but it’s not the worst.”

_web.webp?t=1782975812)

_web.webp?t=1782975679)
